
Improving Qwen3.5-9B on τ³-Banking using PivotRL and fewer than 250 tasks
 Michael E.
 Parth P.
We improved Qwen3.5-9B from 11.3% to 17.5% pass@5 on τ³-Banking using AfterQuery’s off-the-shelf τ customer service data. We first distilled Qwen3.6-27B into the smaller model, then applied PivotRL using teacher solutions for only 50 tasks.
Methodology
Stage 1 — Hybrid OPD–RL
On-policy distillation (OPD) trains a student using a teacher’s token-level feedback on the student’s own responses. We combined OPD with binary-reward RL.
The objective gradually shifted from pure reverse-KL distillation (β=1) toward binary-reward RL (β→0). We retained an early checkpoint after 11 updates, using only 176 tasks and 1,408 rollouts. Distillation still dominated at this checkpoint, which became the reference policy for PivotRL.
Stage 2 — PivotRL
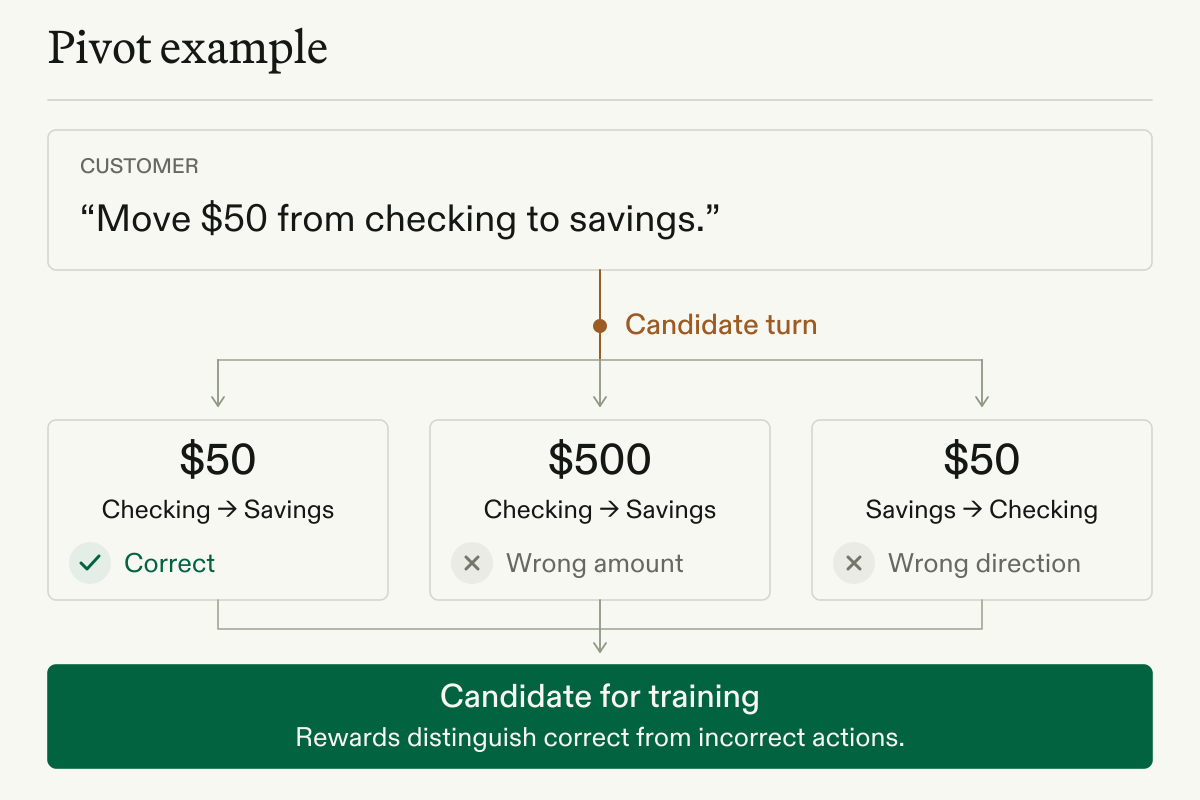
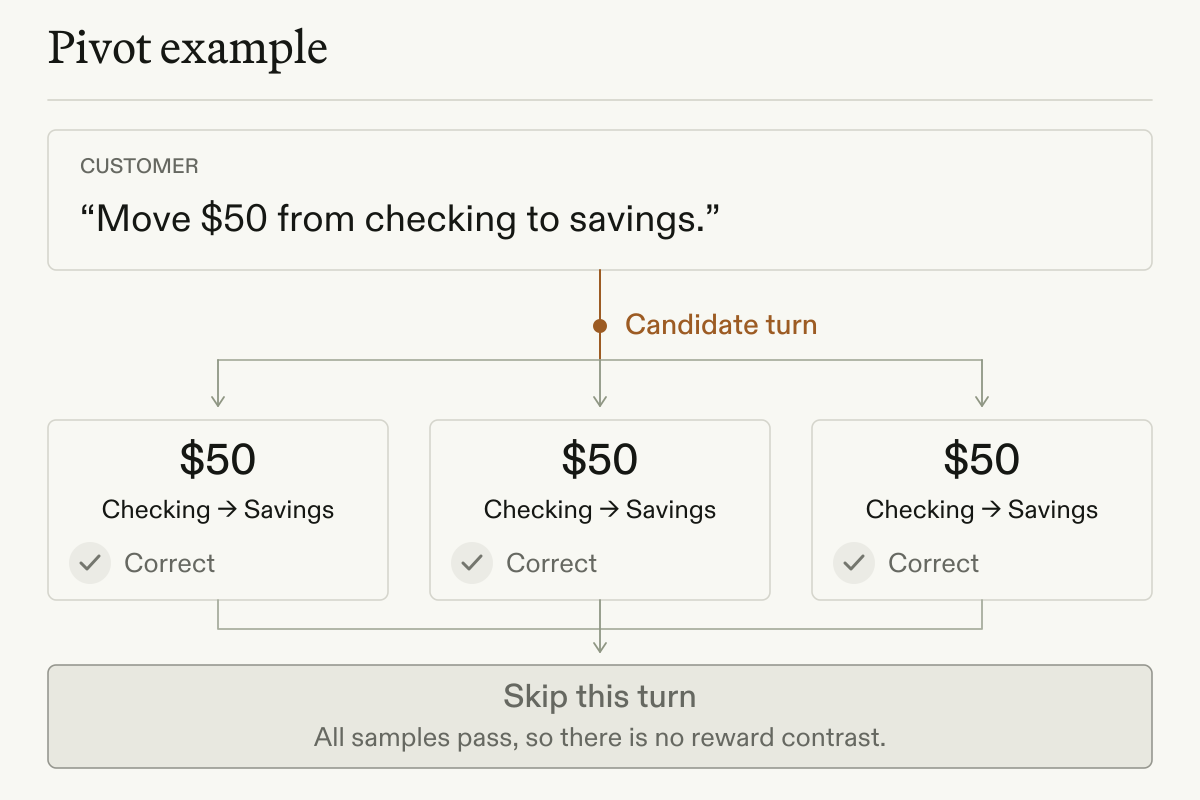
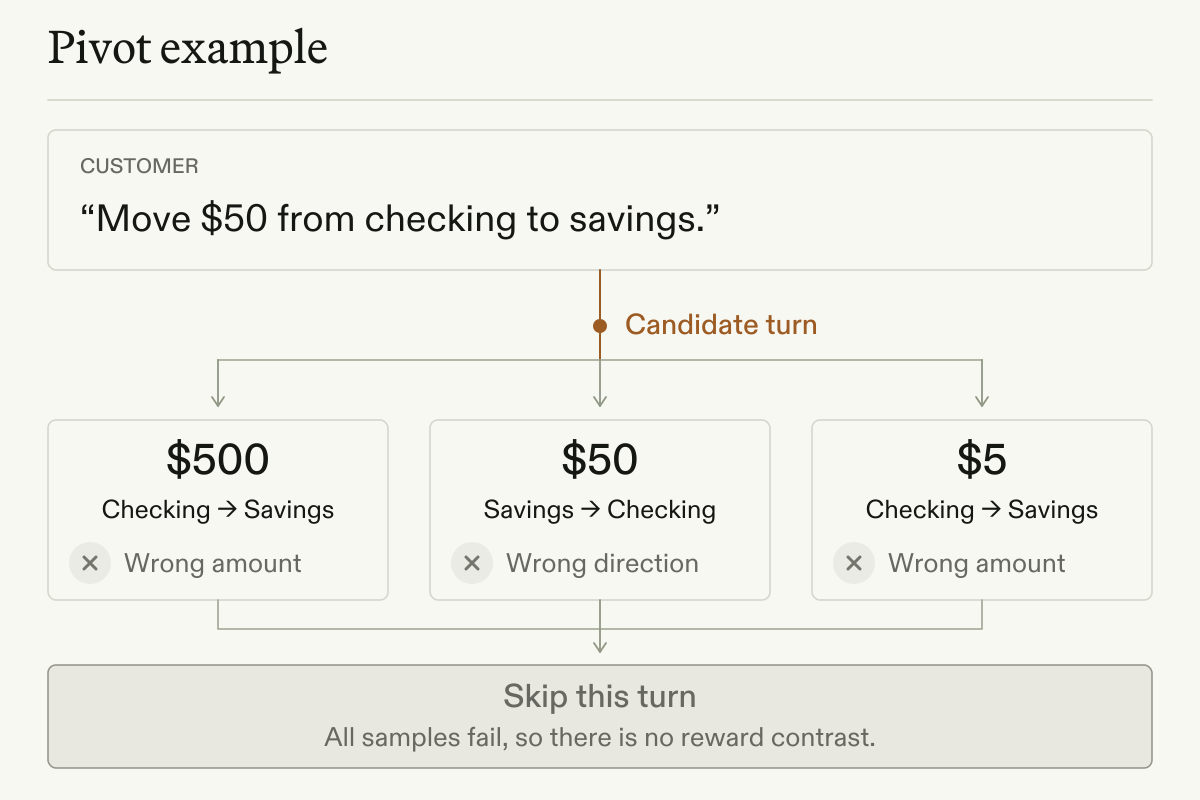
PivotRL (Yi et al., 2026) is a turn-level RL method. It starts from existing SFT trajectories and treats each assistant turn as a possible training state. For each candidate turn, it samples several next actions from the frozen reference policy and scores them with a verifier. It keeps turns with mixed outcomes (some pass, some fail) and average reward below a difficulty threshold, discarding uniformly solved or uniformly failed turns. RL then samples fresh actions from the current policy at those retained “pivot” turns, using verifier rewards for locally valid actions rather than exact matches to the demonstration. On SWE-Bench, the paper reports accuracy comparable to end-to-end RL with about 4× fewer rollout turns.
We profiled 193 pivots from only 50 solved teacher trajectories. A functional-equivalence verifier checked whether each sampled tool call did the same job as the teacher’s example. For lookups, it compared behavior in the replayed environment; for actions that changed data, it compared tool arguments after standardizing their format. This let PivotRL reward equivalent actions even when their tool-call text differed from the teacher’s.
| PivotRL setting | Value |
|---|---|
| Loss | CISPO with asymmetric clipping [0.0, 4.0] |
| Advantages | Mean-centered: adv = r − mean(r), bounded |adv| ≤ 1; no standard-deviation normalization |
| Learning rate | 1e-5 |
| Pivot sampling | Beta-posterior sampling |
| Group size | 16 continuations per pivot (G=16) |
| Pivot batch size | 16 pivots per step (B=16) |
Results
We evaluated on the 97-task upstream τ³-Banking split, running each task five times with gpt-5.4-mini as the user simulator and judge and a 64k context length. Pass@5 measures the share of tasks solved at least once; avg@5 measures the average success rate across all five attempts.
- pass@5
- avg@5
Base
+ Distillation
+ PivotRL · step 15
Both evaluation metrics peaked at step 15. Further training increased in-sample verifier rewards without improving either metric.
General capabilities
We evaluated the base model and our selected checkpoint on six reasoning, knowledge, instruction-following, and coding benchmarks using NeMo Evaluator, with thinking enabled and the same evaluation harness.
Every 95% confidence interval included zero, so these evaluations did not establish a gain or regression on any of the six benchmarks.
To access AfterQuery’s off-the-shelf τ³-bench dataset, get in touch.